Vimal Patel21/05/21
6 min read

Data - a word which some thrive on and which scares the living daylights out of others.
But when you break down data and make it more manageable and understandable, it need not be scary. It becomes powerful and supports you in making good decisions.
It can feel like a monumental leap to go from data novice to data ninja when you have so much all around you so it helps to categorise what you have and then recognise the information which will help.
This article looks at a number of those potential categories and provides guidance on what data might be available and how you can use it to make better decisions as part of your charity's digital transformation.
We’ll delve into:
Charities exist because they want to do good things, often for people needing support. And there’s a wealth of information about those people which can help make your charity ever more helpful.

To begin with there is basic personal information - age, gender, where they live. Then you can dig deeper into how they engage with you - how many times in a given period, at what times of day, in-person or digitally.
Then you can dig even deeper into what support they needed at those different times, what led them to reach out and how you helped.
All of this data will not only assist with your understanding and subsequent approach with the individual but can begin to form patterns across your entire service user base so that you can make solid predictions about future needs.
For example, does the data tell you that you receive an increase in calls for help at a certain time of the day or at particular points of the year? This can help you increase the number of volunteers on hand to provide support when it’s most needed.
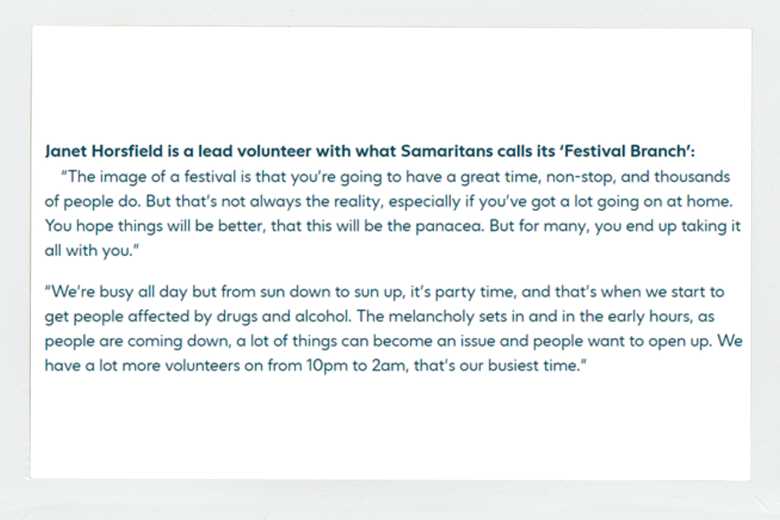
Take a look at this example from Samaritans. The charity has provided support at music festivals for nearly 50 years and the data they have captured now means they have most volunteers available at their busiest time, from 10pm to 2am.
With the advent of service delivery being carried out digitally, much of this type of information can be automated. Individuals’ accounts can be matched to meeting invites; if support calls are confidential, times and days can be recorded automatically and information logged using a set of predefined keywords which can then be analysed to spot patterns.
And this is the primary objective of any data gathering and analysis exercise: to spot patterns so that you can make better decisions from what you see.
If your charity doesn’t hold much information or you feel that you have gaps which, if filled, could make a difference, a survey can be a useful tool.

Online surveys can be created and sent in very little time. Google Forms is free and intuitive; if your charity uses Microsoft then its forms functionality is also very simple to use.
One tip when using surveys to capture data is to be very clear on what you want to find out. Vague and too open-ended and you’re unlikely to find those patterns you’re looking for.
Instead of posing a question such as ‘What would you like us to do better?’ you might want to provide four or five options containing the areas you think your charity needs to improve in; instead of asking donors what information they would like to receive from you, make your survey multiple choice.
Surveys are used a lot and people can become irritated by them so make sure they are quick and easy to complete.
They can be used to gather data from service users, donors, followers, volunteers and internal teams to assist with better decision-making right across your organisation.
An example of how this approach can be invaluable can be seen from Macmillan, who reached out to their database to help them understand supporter motivation.
The information they received altered the core messaging around their coffee morning campaign from "send for your fundraising pack" to "order your free coffee morning kit".
The impact was that income raised leapt from £15m to a record-breaking £20m.
The first time most people open up Google Analytics, their eyes bulge, they start to sweat and they need a lie down. But after that initial panic and the realisation that you’re not going to bring down the entire internet by clicking the wrong button, once you begin to get your head around the platform it’s actually pretty intuitive and, for many, rather fun.
The areas you’ll be using the most are these four on the left of the screen: audience, acquisition, behaviour and conversions.
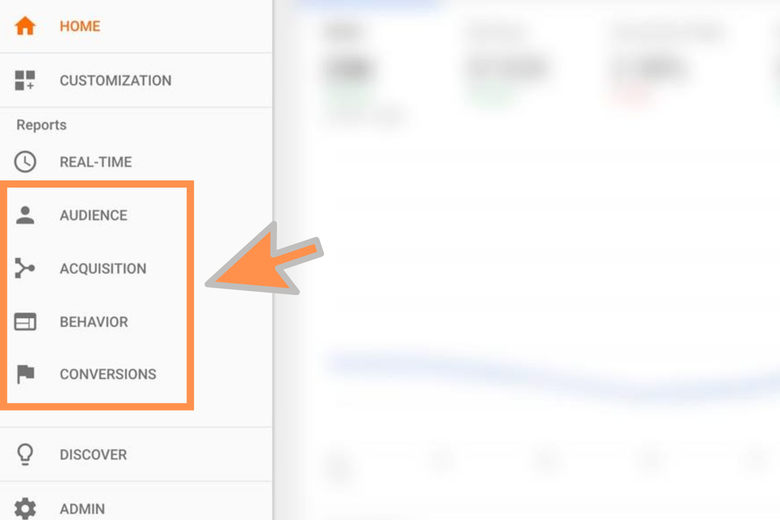
A useful tip to remember when attempting to access what you need is this:
There’s one key element of Google Analytics which you’ll end up using pretty much every time you enter: the calendar. This allows you to select any time period and measure performance, plus you can compare to previous periods or years.
Want to know how many website visitors you had in 2020?
Navigate to the calendar at the top-right of the screen and type in your start and end dates or use the arrows on the calendar itself.
The default setting here is the last seven days so simply adjust the start and end dates to read January 1 2020 and December 31 2020.
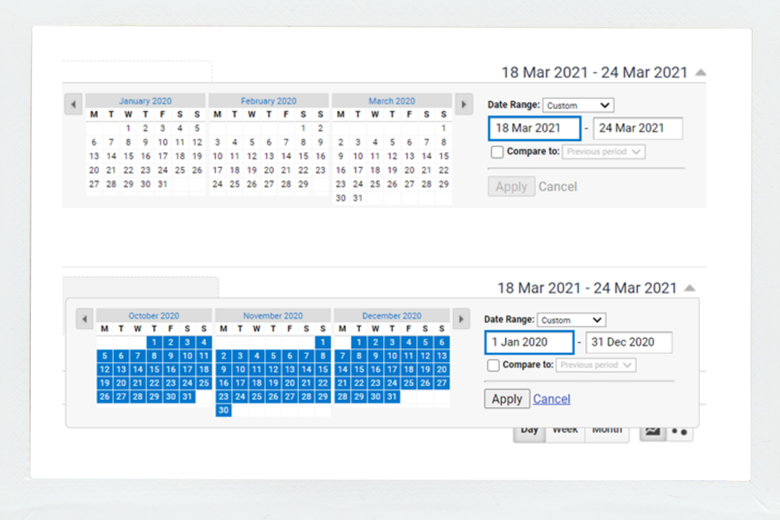
Hit the ‘Apply’ button and all of the data you then analyse will be for the chosen time period.
As you want to see how many users your site had in the year, head over to the acquisition section, click on ‘Overview’ and you’ll get a breakdown of some top-level stats.
In the example below, you can see that this website had 8,719 users in 2020.
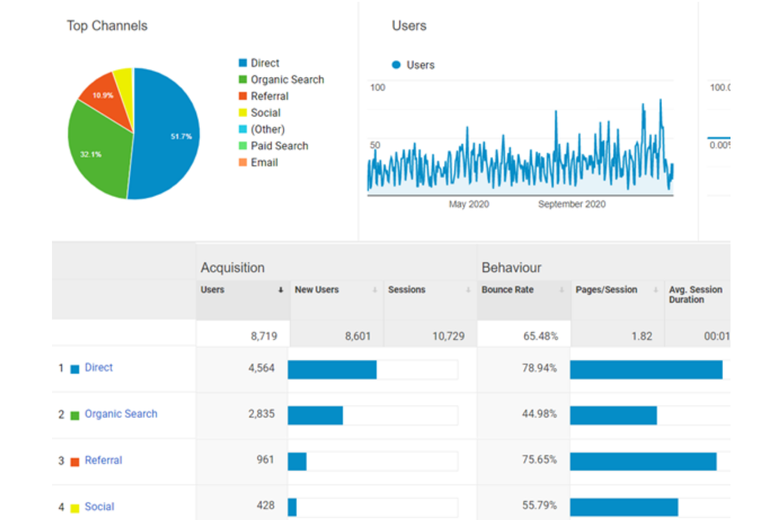
That was achieved with just a few clicks and provided some top-level website information. There is a huge amount of data available in Google Analytics and you can find pretty much any information on your site within the platform.
More advanced features will allow you to create specific data dashboards, set up tracking campaigns for email and capture certain behaviours such as the number of times certain videos are viewed on your site, but just simply getting comfortable with the platform and knowing where to find the answer to a specific question will stand you and your internal teams in good stead to make better decisions when it comes to website design improvements.

Arguably, the area where you will have the most data points is digital marketing. This is because every click, every thumbs up, every word you type is being tracked.
Let’s take a look at some of the most important areas within digital marketing channels.
Search Engine Optimisation (SEO) - take a look in the Google Analytics accounts of every website in existence and you’ll see that the vast majority receive their traffic from organic search i.e. the listings on Google, Bing or another search engine which appear below any paid-for advertising slots.
And a large number of website visits coming from organic search will be for what is called ‘branded’ terms. These are where searchers have typed your charity’s name, or a variation of it, and then clicked the organic listing containing your website.
You’ll want to make sure you’re in the top spot for those branded searches because users are wanting to find you. If you’re down in position 2, even, you will miss out on some of that traffic and that’s akin to a footballer missing an open goal from a yard away.
Where organic search becomes arguably more interesting is when you start to consider the non-branded keywords or search terms that you would like to be on page 1 for.
Let’s take the example of ‘UK children’s charity’. A quick check in Google’s Keyword Planner tool shows that this term has between 10 and 100 monthly searches:
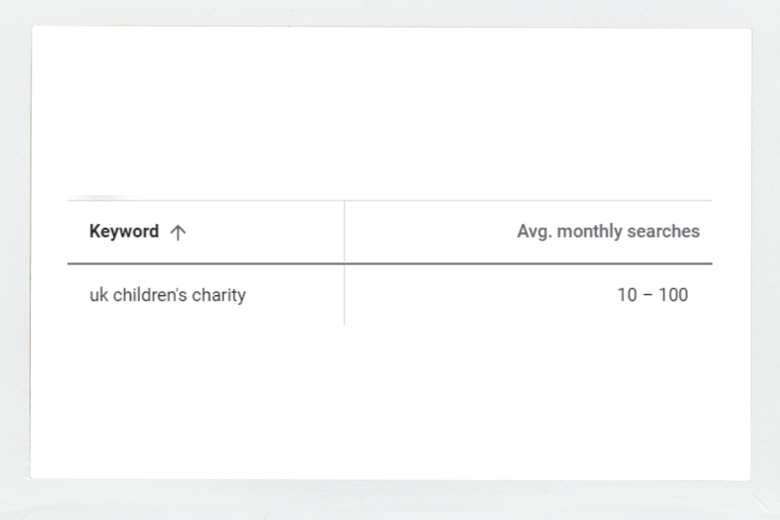
Now, you might think that isn’t very many but remember that’s just one search phrase in a sea of oceans of search phrases. And if you’re a UK children’s charity, it’s obviously highly relevant.
The Keyword Planner tool is a rich source of data. Within it, you can find keywords which are similar to the ones you’ve thought of, the number of searches being made for that phrase plus how much it might cost you if you were to run some Google Ads for those terms.
Due to the sheer number of searches made on any given day, it is impossible to predict how your website might be found - so, ideally, you’d need some help with that.
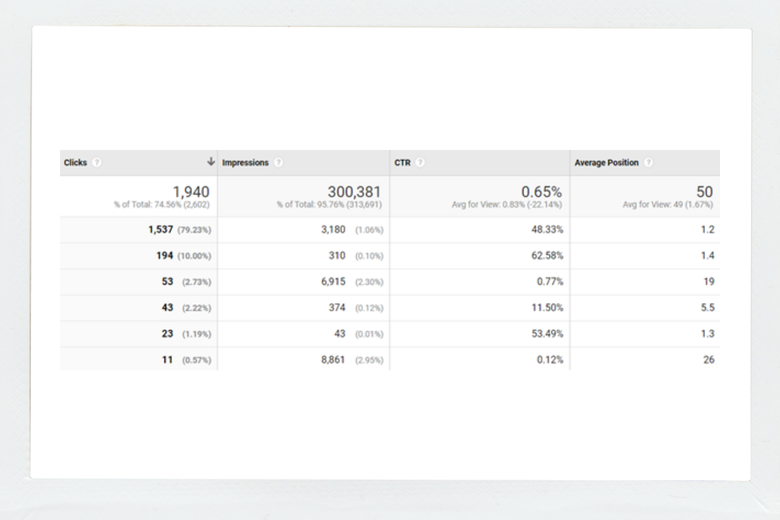
And this is where another Google platform comes in handy. It’s called Search Console and it allows you to see the keywords users have typed which have not only resulted in them visiting your website but also where your website has been shown in organic listings but not necessarily clicked on (these are recorded as ‘impressions’).
You are also given the clickthrough rate (CTR) of those keywords and their average organic search position.
Search Console provides information on both branded and non-branded terms.
For more advanced SEO data to help you get an instant picture of your position for keywords, how ‘competitors’ are performing and more, you’ll need to invest in a third-party platform such as Ahrefs or SEMRush.
Pay-per-click (PPC) - If you are running Google Ads campaigns it’s going to be costing money. Even if your charity is in receipt of a Google Grant, it’s still good to know where that is performing well and not so well.
After setting up your ads account and targeting some keywords, you’ll soon be able to start analysing some data.
One of the most important metrics will be the CPC, or cost-per-click i.e. how much is it costing your account when a user clicks on your ad and ends up on your website.
You’ll also be able to see the number of times your ads appear (impressions) and the percentage of users who saw an ad and ended up on your website (clickthrough rate). So if your ad has 100 impressions and 10 people clicked on it, your clickthrough rate will be 10%.
You can also view conversion data so if you’re running a specific ads campaign in order to get eyeballs on a new research paper you’ve published, with a little bit of tracking implementation you will be able to view your cost-per-conversion.
Email - a channel which is still one of the best-performers for many organisations, it contains a few data points which can be analysed to improve performance.
First up is open rate - the percentage of your emails which were clicked on. A low open rate could be down to a few reasons including users not wanting to engage with you, subject lines which fail to entice them or the simple fact that they were missed in a cluttered inbox.
One of the most important metrics is clickthrough rate. This shows you that not only did recipients open the email but they actively engaged in it and clicked on one of the links you included.
Another key metric is conversion rate - the number of clickers who completed an action on your website. Going back to the research paper, if you have the download of it set up as a conversion and you send out an email to your subscribers, you can track its success. Therefore, you have a sense of ROI although there’s obviously no monetary value involved.
Another important data point to keep track of is the email bounce rate which measures how many addresses didn’t receive your email. Soft bounces indicate temporary problems with addresses while hard bounces track permanent problems.
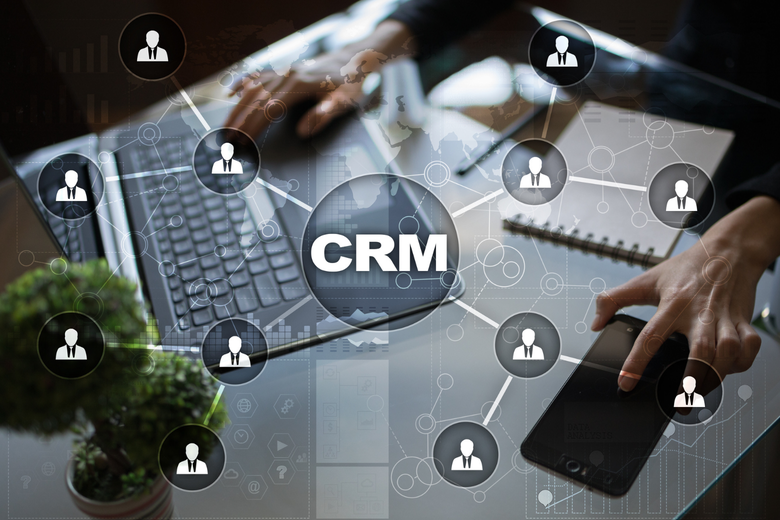
The use of Customer (or Constituent) Relationship Management (CRM) platforms is on the increase within the charity sector - for good reason.
Such systems allow charities to maintain, in one central area, records of donors, volunteers and other key relationships, keep track of communications and interactions with them and provide the ability to segment these records for marketing and communications purposes.
They are particularly beneficial to - and probably only required by - charities of a certain size with a significant number of records to manage.
One regular use of a CRM is for marketing and this is where the ability to segment those records comes to the fore.
Let’s say your charity is running an offline event in a particular location and you want to communicate this only to followers who live within a certain distance - a good CRM will allow you to carry this out.
Alternatively, you might want to segment by largest donors, by age or even by most active. CRMs allow you to store all communications and interactions which means that a chain of emails can easily be accessed by anyone at any point.
Such systems are also set up for automation, which means that you can create processes to make contact with donors or volunteers at given points, for example reaching out to them if they have been inactive for a given period of time, or creating separate thank-you messages based on donation amounts.
There are many CRMs on the market and the process of finding the right one for you might feel a little daunting. This article on Charity Digital provides a few suggestions so is a good starting point.
Also, take a look at the comments on this post on UK Fundraising and you’ll see the likes of ThankQ, Blackbaud, Salesforce and Dynamics receive honourable mentions.

Charity campaigns are moving online - whether digital-only or as part of a wider multi-channel push.
A particularly attractive feature is the ability to measure the effectiveness of the digital elements of a campaign across a range of metrics.
These include data on donations, websites, email, social media and there are many primary and secondary areas within each.
It’s easy to get swamped with a whole bunch of metrics and that can lead to data blindness with no value so it is crucial that you understand what you want to know from your campaigns.
During the course of campaigns, primary metrics might include:
These primary metrics can be used to provide an at-a-glance report on the performance of the campaign - something which might be required by senior people within the organisation who don’t want to dive into detail.
While these top-level metrics are vital to understand the overall performance of a campaign, secondary metrics will ensure you can answer the ‘why’ questions.
Based on the above, some of the secondary metrics might include:
By aligning your primary and secondary metrics like this you will be able to answer not only what the results were but begin drilling down into how they were achieved.
This information can then help you shape your marketing activity for future campaigns, who to target, what channels to use and what messaging to use.
If your charity has an online shop - and the prediction is that digital is the future for them - new areas of data will become important.
While you will want to continue to track traffic to your website, you will also want to set-up e-commerce tracking within Google Analytics as this will provide more information on the performance of your shop.
E-commerce metrics within Analytics include:
There are other areas within Analytics which might be useful and you will want to use your e-commerce platform (Shopify, WooCommerce, Magento etc) dashboards to keep track of the performance of products as well as customer data, where you will be able to view regular online shoppers which could lead to providing those most valuable with a little thank-you gift in their next purchase.
If you’re feeling utterly overwhelmed with the amount of data at your fingertips, there are some organisations which can help.
DataKind UK and Data Orchard assists good causes with their data needs, training and analysis so might be able to lend a hand when you need.
Data’s great but you can reach the point where you feel swamped and fall into the trap of ‘analysis paralysis’ - where you seemingly spend your entire day staring at numbers and reports.
The key is to make sure you know what you’re looking to achieve and use the data to measure. Data analysis should lead to actions, not merely reports which sit gathering virtual dust.
Always ask yourself ‘So what?’ when analysing data because the work you do as a result is where the magic happens. The data is simply there to set up the trick.
Share this:


Vimal Patel
Founder at Giant Digital
Vimal is Commercial Director and founding partner at Giant Digital. With digital expertise gained from over 20 years in the sector, combined with his experience as a charity Trustee, Vimal has a detailed understanding of the challenges faced by charities and is passionate about finding effective digital solutions that bring about lasting positive change.


Jon AtkinsonDec 21, 2020
6 min read